Tuesday, October 28, 2014

CITY FINANCES

City Financial Outlook


   The city’s financial outlook is not as bleak as some would have you believe, and to say the city has no plans to restore finances to previous levels is simply an ignorant statement, by which I mean, the author of that statement failed to do some basic research.

   In 2013, the city generated a $10 million surplus, and this year, the surplus is projected at between $7.5 million and $10 million. It’s exactly for that reason that the city was able to hold the tax increase for 2014 to a 0% increase, the first time in at least 15 years. That required planning.

   As at December 31, 2013, the city had nearly $130 million in cash or cash equivalents, comprised of surplus/reserves ($94.1 M), DCC’s ($14 M), and deferred revenue ($21.1 M). This information is readily accessible in the city’s audited annual financial statements. Long-term debt existing from before 2006 has been repaid on an accelerated basis due to the city’s strong cash position. That required planning.

   I’ve written about the city’s debt in a previous article, but will repeat some of that here, to give the reader a more complete picture of the city’s financial state of health. The city has not been debt-free, at least as far back as 1997. In 2006, the long-term debt stood at $38.4 million, down from $45 million in 2005. Audited financial statements show that Abbotsford had $78.4 million in total long-term debt at the end of 2013 (projected to be approximately $73.0 million at the end of 2014). This long-term debt, which has a very favourable fixed interest rate until maturity, is almost entirely related to the three Plan ‘A’ projects, which were approved by the citizens in a referendum.

   In the last eight years, the city has managed to complete significant infrastructure projects and capital improvements totalling well in excess of $200 million, while long-term debt increased by a net of only $40m million. That required planning. The list includes: expansion to ARC, Discovery Trail, the Reach Gallery/Museum, Abbotsford Centre, McCallum and Clearbrook interchanges (our portion was 1/3 cost on each), Airport improvements (1/3 cost), Whatcom Road Connector, new Firehall, impoving and raising Dikes, new library, land acquired for Mill Lake Park, upgrade of water mains, upgrade of James Treatment plant, drilling of Bevan Wells (emergency supply when Norrish Creek water line became disabled in 2013), and upgrade of all-weather fields. This does not include all the annual capital projects accounted for in departmental budgets, such as Engineering annual $5 million Roads budget.

   It must also be noted that the two interchanges were completed well under projected budget costs, allowing the city to construct the climbing lane on Highway #1, between Sumas Way and McCallum Interchange, and to make the significant road improvements to Marshall Rd. between Clearbrook and Mt. Lehman Roads, and Clearbrook Rd. south of the interchange to King Rd. These capital projects would normally have been entirely funded from city funds; however, in this case the city’s cost was only one-third of the total cost. Moving forward, in the short term, the city will need to focus on the replenishing of funds used from DCC funds to complete the two interchanges.
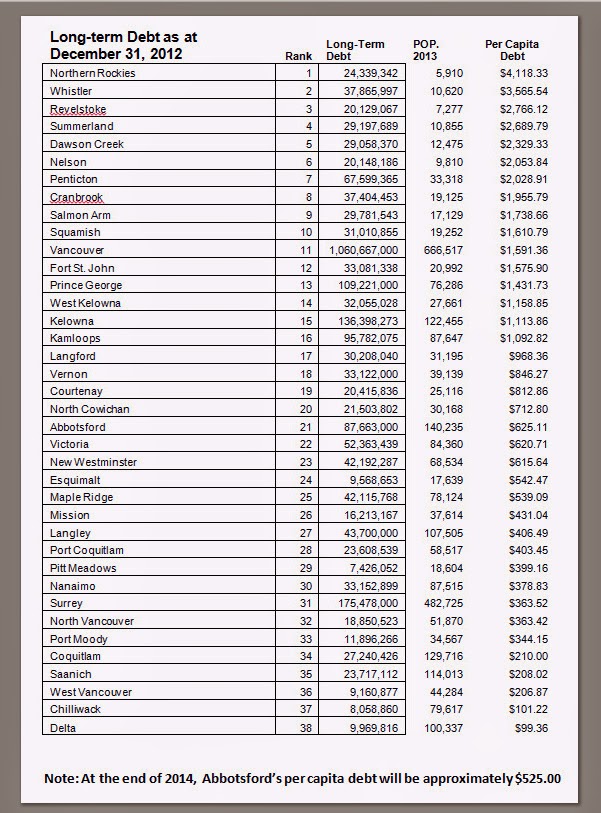


   The above table is based on the latest available data (2012) supplied by the Ministry of Community, Sport, and Cultural Development. On a debt per capita basis, Abbotsford is ranked 21st in the province. Based on the projected long-term debt of $73 M. at the end of 2014, the figure will be approximately $525/capita.

   What needs to be noted with these figures, with respect to metro municipalities, is that Metro Vancouver debt is not factored in. In 2012, Metro Vancouver had a debt of $370 M., which is shared by all its member municipalities, on a per capita basis. This debt relates to their shared utilities: water, waste, housing, and corporate programs. This would include 11 of the municipalities on the table that show lower per capita debts than Abbotsford.


   While my background is not in the financial world, it is my humble opinion that the city’s financial position is under very good control; infrastructure is in good shape; and the city is poised to make continued progress in terms of strengthening our financial health. 

Saturday, October 25, 2014

WATER RATES

Abbotsford Water Rates

   I recently spoke with a friend whose children live in Germany. He was telling me how restricted they were in the use of water - for washing, for showers, etc. Their cost of water was in excess of $5.00 per cu. metre. I was not totally surprised, but nonetheless, I am very thankful for the abundant supply we do have and for what it costs my household to have running water. Our residential cost is $1.15 per cu. metre.


   The joint Abbotsford Mission Water system consists of 18 wells, Cannell Lake supply, Norrish Treatment Plant, 91 kilometers of pipe and 16 pressure reducing stations. The system has a replacement value of $138M. 

   The following three graphs provide a comparison with our neighbouring municipalities, as well as some other large BC cities. The majority of households will fall in the middle category. 


Friday, October 24, 2014

PROPERTY TAX RATE RATIOS

A. Rate Ratios (2014): Personal Property/Business Property


B. Rate Ratios (2014): Personal Property/Light Industry Property


Wednesday, October 22, 2014

The Facts About Tax - Property Tax!


Note that Abbotsford property tax has actually dropped from 2013 to 2014!


Monday, October 13, 2014

Sustainable Development & Growth

     A recurring experience for me, while on Council, has been the opposition of citizens to a proposed development in their neighbourhood. The most common reasons offered are: increased traffic (safety), property-value depreciation, air and noise pollution, and environmental concerns. This will, more often, occur when rezoning is proposed. The irony in many situations is the fact that the homes they live in may have once been developed in opposition to the existing neighbourhood at the time.

     Making the right decisions is not always as easy as one would think, however, it is hoped that each Council member is guided by the best interests of the greater community. Local government is charged with providing essential services to its residents and the responsibility to manage new development, both in a sustainable fashion.

     A guiding principle of sustainability is to be guided in our efforts to provide services and manage development without compromising the ability of future generations to provide for their own needs. To that end, the City of Abbotsford has implemented a variety of initiatives over the last years to address this concern, ranging from waste disposal to energy conservation in government buildings.

     In 2011, the Community Sustainability Planning Initiative (CSPI) was initiated and by 2013, five projects had been completed. Together, they are intended to enable the City, along with its partners, to build on existing sustainability successes. The end result will hopefully, be a “liveable, sustainable and prosperous community”.

  1. The Community Sustainability Strategy (CSS) is a high-level vision statement and framework. It’s the strategy that guides all initiatives that follow.
  2. The Appendices that accompany the CSS.
  3. The Green Energy Plan (GEP) is a resource, not only for local government, but also for the private sector. The GEP recommends strategies and action plans for reducing Green House Gas and for reducing energy use.
  4. The Green Community Plan (GCP) provides all of us – public, private business, and the City – with strategies for providing our citizens with a “healthy and rewarding quality of life”.
  5. The Green Economic Investment Study (GEIS) examines how both the City and private partners can advance the economy while incorporating initiatives that will enhance the environment. Such initiatives may include how they operate (LNG-powered trucks) or construct their buildings, with the ultimate goal of conserving energy and preventing pollution.

     Across Canada, the infrastructure deficit has become increasingly more serious. All infrastructure has a lifespan and will eventually have to be replaced. This has been putting significant strain on local government finances, particularly in the East, where towns and cities have older infrastructure.

     One of the key pieces of Abbotsford’s CSS was the creation of a dedicated staff position for managing the City’s assets. This asset management is integrated with consideration of lifecycle of infrastructure investment, alongside land-use planning decisions and financial management. This strategy is intended to result in fiscal, social, and environmental sustainability for Abbotsford.

     For more detailed information on the CSPI, visit: 


Wednesday, October 8, 2014

OUR CITY DEBT

The Truth About Our Debt


   Let's get one thing straight at the outset - I don't like debt, and I don't believe anyone else likes debt, but like life, it happens!

   I've read numerous opinions about the City's debt, including some erroneous facts. Unfortunately, too many people accept those opinions rather than checking against reliable sources. If you should doubt me, please do corroborate what I state against City Annual Reports and provincial ministry stats (where most of my information comes from).
                             http://www.cscd.gov.bc.ca/lgd/infra/statistics_index.htm

   Abbotsford and Matsqui amalgamated into one municipality in 1995; my data includes the years 1997 to present, so when I say Abbotsford has never been debt-free, I am assuming it had a debt in the two years immediately following amalgamation.

   It is has been publicly stated that Abbotsford was debt-free in 2006, which simply is not true. The City had a debt of $38.4m. The closest the City came to being debt-free was 2004 ($16m.). Of course that debt was greatly increased as a result of the elector-approved capital projects (Plan 'A'), resulting in a maximum debt, in 2008, of $104.8m. Today, the City's long-term debt stands at $78.4m. as of December, 2014. I need to acknowledge an error in an earlier post, on this topic, in that I stated debt figures that are not in agreement with the data I cite here.

   The debt has decreased by 25% over the last six years, which correlates with the fact that part of it has been amortized over 25 years (The Reach portion was amortized over 20 years). Like any homeowner, one always considers capacity for carrying debt and how much debt is reasonable to carry. In the City's case, debt principle and interest costs amount to less than 5%, annually, of the City's total budget.


   At the end of 2013, Abbotsford's per capita debt was $625, and will be approximately $525 at the end of this fiscal year. How does this compare with other municipalities? Twenty other municipalities have higher debt burdens, with most of those in excess of $1000. As I said at the outset, I am not advocating for continued debt. What I am trying to convey here is that we have never been debt free; we have a debt resulting from elector-approved capital projects; we have a plan to pay it down (called a mortgage); and that the debt is not more than Abbotsford has the capacity to carry.


Friday, October 3, 2014

Assessed Value, Tax Rates, and Total Tax Revenue


Comparing Tax Rates

Tax rates are not a direct indicator of comparative tax costs between cities. They must be interpreted in conjunction with average assessed values, which vary significantly between cities. Without that reference point, they are meaningless.


Comparing Total Taxes and Charges on Representative Properties

The Province of BC publishes a listing of “Taxes and Charges on a Representative House”. This is the closest data comparison available to compare relative tax burdens between cities for residential properties. It shows what a typical house in each city pays annually in total taxes and charges (both municipal and non-municipal).


Assessed Values are a Useful Tool for Allocating Tax Charges

Assessed values are a good tool for allocating the city’s tax requirement across properties. More expensive properties (those with conceivably greater ability to pay) pay higher taxes. Less expensive properties (those with conceivably lesser ability to pay) pay lower taxes.

Assessed values are not a good tool for dictating the city’s total tax requirement. Assessed values have virtually no relationship to municipal expenses, so it follows that they should not drive tax revenues. Why, for example, should the city increase its tax revenues by 10% in a given year, simply because land values have risen? Similarly, does the fact that Abbotsford has lower land values than Vancouver or Surrey automatically mean that it has lower costs of doing business? With very limited exceptions (e.g. land purchase for road right of way), the answer is no.


How Abbotsford Calculates Tax Charges on Specific Properties

1. Council approves a total tax revenue requirement, separate from any market movement in assessed value (which has no impact)

2. The tax rate is set such that the total required tax revenues will be collected from properties, given their current assessed values. (Council has the option to choose to allocate tax charges in varying proportions to each class of properties.)


3. The total tax charge per property class is allocated to specific properties in proportion to their relative assessed values.